The Skeena River Water Conservation Project (SRWCP) was designed to develop and test an approach for managing water values and resource development, using existing land management objectives and scenarios about possible future conditions. This project built on Cortex's previous cumulative effects analyses (e.g., Klappan, PMT), ecological modeling (e.g., Spotted Owl Management Framework), and extensive experience in forest estate modeling and land use planning. The spatially-explicit Integrated Watershed Management (IWMF) used for the project is a component of Cortex's CREATe approach for assessing cumulative effects of natural resource development at a landscape scale.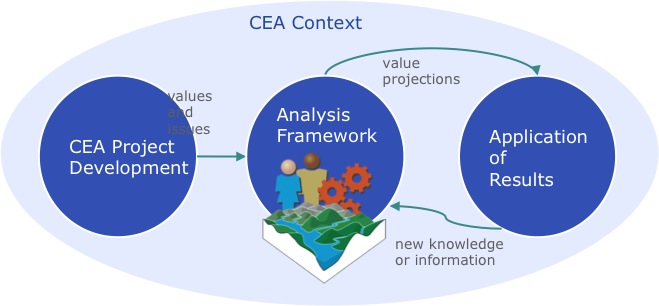
Key elements of the IWMF include: (i) a process-based forest estate model; (ii) a run-of-the-river power projects model; (iii) spatial graphs-based approach for projecting linear infrastructure development (e.g., roads, pipelines, transmission lines); and (iv) potential shifts climate as represented by shifts in ecosystem envelopes. IWMF results are reported through spatial and tabular outputs. Spatial outputs include time-series maps of several landscape attributes. Another spatial output are network indicators that take into account the connectivity and hierarchical structure of network elements (e.g., roads and streams), such as the accumulation of effects moving down a stream network from headwaters to any point downstream. Tabular results are presented as comprehensive tables that stratify the study area by several landscape attributes (e.g., landscape unit, ecosystem type, seral stage, development type, steep slopes) and report the area represented by each strata. From these tables, a wide range of indicators can be produced (e.g., length of roads by slope class, forest harvested by ecosystem type, density of road stream crossings by watershed, Equivalent Clearcut Area) to assist experts from different fields in assessing potential impacts on a variety of values. 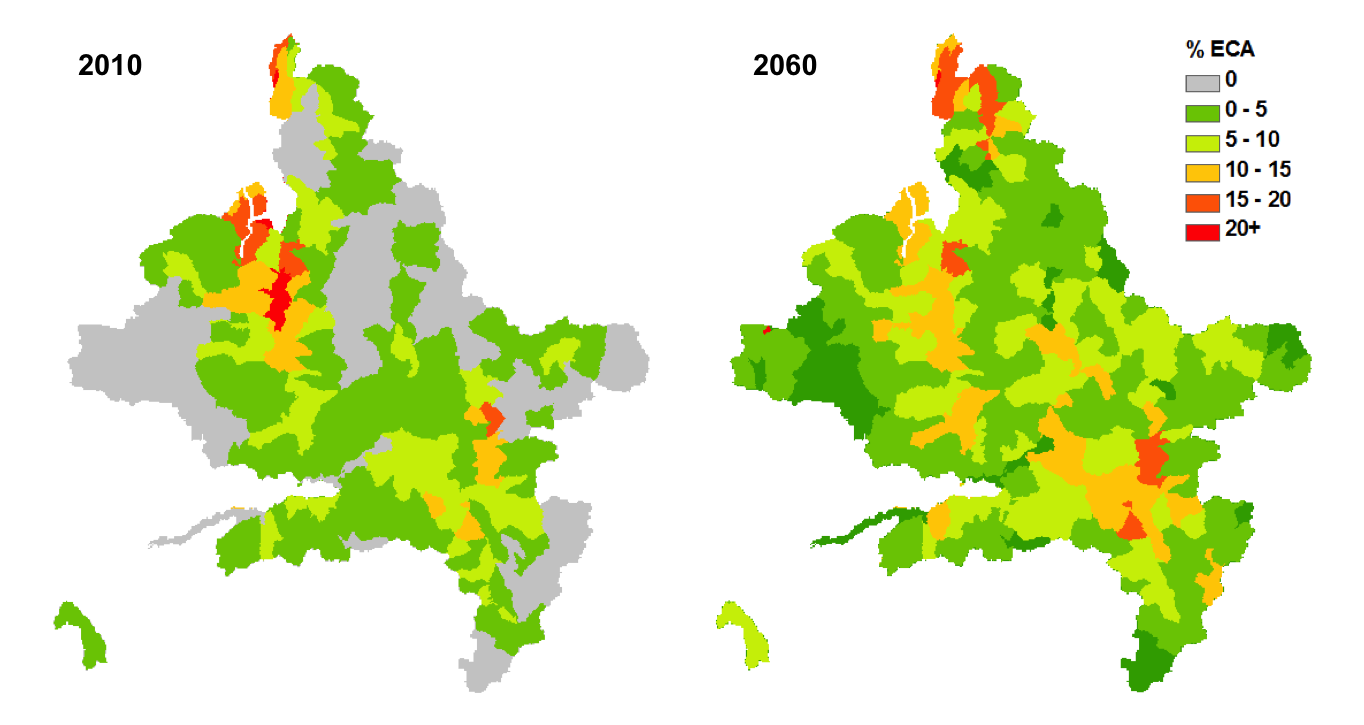
Percentage Equivalent Clearcut Area (ECA) by watershed